
Primer: Family and Future Series Savings Compendium
Family and Future Series
The animating concern of this series of primers is the future of healthy family formation. It is a central purpose of government to cultivate a country in which its citizens can marry, have children, and remain married. The financial obstacles to that way of life are addressed throughout the series
Background
Throughout American history, the ideal has consistently been that children should be raised by their parents within a lifelong marriage on a single income.1 The ability to care for one’s own children is a social good of the highest order, and federal and state policies should facilitate conditions under which this ideal is attainable for a majority of families.2 However, many households are grappling with higher costs of housing, health care, child care, transportation, utilities, and food, prompting widespread frustration that official economic metrics fail to capture everyday realities. These economic obstacles are but one problem among many facing American citizens.
The decline of American culture stemming from the decades-long capture of our institutions by secular and progressive forces sits at the heart of our public policy challenges. The purpose of the Family and Future Series is to address one aspect of this decline: the financial burdens imposed on individuals and households by policies that deprioritize family formation in favor of godless government bureaucracies. The Center for Renewing America (CRA) believes that a healthy community and a virtuous society should ultimately be the most important considerations for policymakers. At first glance, these papers, with their focus on specific economic factors, may appear to depart from that effort; however, the purpose of this series is to build an economic framework that delivers that more lasting result: the renewal of the nation’s people and the reinvigoration of the American spirit.
The economic burdens on American families have been decades in the making and are almost exclusively the result of heavy-handed progressive policies, profligate federal spending, weaponized regulatory activities, and supercharged welfare programs—most of which accelerated under the Obama and Biden administrations. The Family and Future Series is a paradigm shift, dispelling the notion that another tax cut or broad deregulation effort will put families in a position to thrive. While those are good and necessary policies, the Trump administration’s more intentional approach to specific regulatory actions in the energy and environment sectors has begun to provide relief for overburdened households facing high costs imposed by anti-family, big-government policies. This is the exact kind of progress we believe must continue across all sectors to free people to thrive and live virtuously.
The Family and Future Series includes roughly sixty specific policy suggestions across six broad issue areas. We would welcome another sixty ideas from policymakers and elected officials that would accomplish the goal of freeing Americans from barriers that impede family formation, shackle opportunity, and corrode healthy communities with destructive ideologies that intentionally stand in the way of family formation. Importantly, the series is a response to a concern that most Americans share: The core aspirations of our lives are, at the moment, too costly and too difficult to achieve.
In November 2025, the Wall Street strategist Michael Green wrote a viral Substack essay arguing that the federal poverty line for a family of four, officially around $32,000 and rooted in methodology from 1963, is obsolete and that updating it to reflect today’s spending patterns yields a “crisis threshold” of roughly $140,000 annually as the true income floor for the cost of participation in the American economy without relying on government benefits.3
The Family and Future Series aims to address specific concerns Green raised in that essay about the costs of health care, housing, food, child care, and transportation. While we agree with his basic premise that Americans feel poorer every year despite the country’s economic growth, his metrics are higher than the reality for most of the country. After extensive research into the current costs associated with the categories listed above, CRA has determined that the average cost of participation in the American economy is $105,000–$110,000 in gross annual income for a family of four.
It should be noted that the broader political framing of “affordability” betrays an underlying sentiment that the government can and should proactively make life affordable. The policies prescribed in the Family and Future Series dismiss this counterproductive premise: The overwhelming majority of policy suggestions either remove existing government policies that drive high costs or promote community solutions to foster a healthier and more virtuous society.
Importantly, the savings outlined in this series offer potentially significant relief for families as we enter into the still-uncertain future of artificial intelligence (AI). Many American households are understandably concerned with AI’s impact on the job market. Lowering the cost of participation will help let air out of the proverbial balloon of the AI revolution as industries experience what is likely to be at least a short-term upheaval.
An America First Vision for Health Care
CRA’s first paper in the Future and Family Series addresses the failures of the American health-care bureaucracy.4 Americans are paying more than ever for care they cannot access.5 After more than a decade of Obamacare, the problems are undeniable, with premiums increasing by a staggering 169 percent over the last twelve years.6 CRA’s proposal separates care from insurance, decentralizes risk, and allows alternative models to compete, thereby lowering costs dramatically and improving quality.7 For example, an average family of four with two forty-five-year-old parents and two children on employer-provided insurance would see the following improvements under several reforms proposed by CRA, which include enhanced direct primary care, health savings accounts, supercharged sharing associations, infinite risk pools, and catastrophic coverage.8
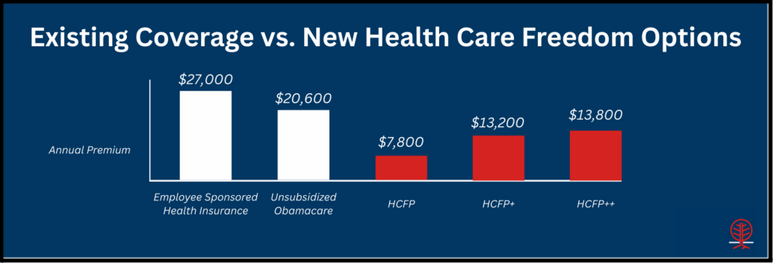
This chart outlines three savings scenarios a family of four can choose from, along with the resulting savings for each, compared with the current U.S. health-care framework. This approach to health-care policy will help solve the family formation crisis, especially when combined with additional proposals from CRA’s Family and Future Initiative.
Family Formation and Child-Care Policies
CRA has also addressed the rising cost of child care as a major issue for growing families.9 Under today’s policy framework, a typical married family with two young children faces child-care costs of roughly $23,164 per year and receives only limited relief through existing credits, leaving more than $17,500 in annual out-of-pocket costs.10 But under CRA’s framework, combining an expanded Child Tax Credit, a marriage bonus, and flexible child-care stipends, the same family could save roughly $17,564 per year, all the while gaining the flexibility for a parent to choose to spend more time raising the children.11
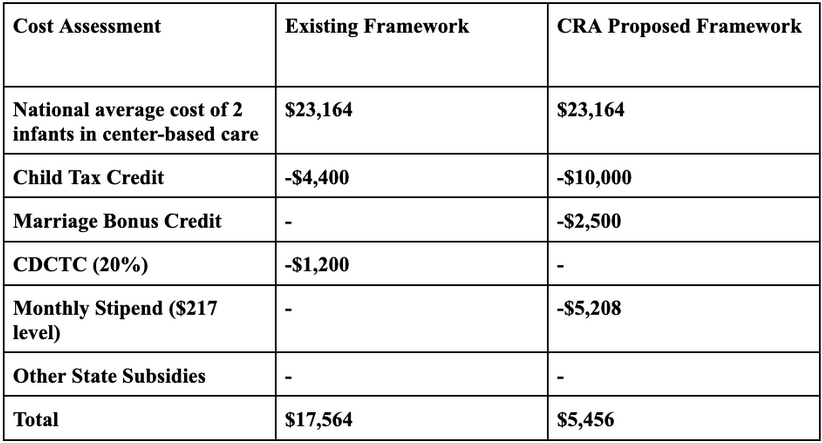
This chart illustrates how the current policy structure provides relatively little direct support to working families, leaving them responsible for the majority of child-care costs, even after accounting for existing credits. By restructuring family policy around larger, direct benefits, particularly an increased Child Tax Credit, a marriage bonus, and flexible monthly stipends, CRA’s framework shifts support toward families themselves, substantially lowering the effective cost burden and making it easier for households to raise children and structure work and caregiving in ways that fit their lives.
Reducing the Costs of Real Food for Families
CRA has also published a blueprint for reducing food costs. In the United States, food has been a significant component of household expenditures.12 Historically, food prices have tended to rise modestly and roughly in line with overall inflation.13 That pattern broke down beginning in 2021.14 From 2020 to 2024, food prices rose 23.6 percent, outpacing most historical annual averages.15 Many are quick to blame global trade issues, weather events, climate change, animal and plant disease, the COVID-19 pandemic, and the Russia–Ukraine conflict as causes for this change. However, the reality is that food affordability is a function not merely of inflation but of structure.16 Market concentration, regulatory distortions, supply chain complexity, and policy-shaped demand patterns all contribute to elevated and volatile costs.17 CRA’s blueprint takes a comprehensive approach, addressing concentration, decentralization, and regenerative agriculture; correcting regulatory distortions and reforms; and realigning nutrition standards and markets.18
Combining these reforms across America’s food system could save thousands of dollars each year for a typical family of four.19 Taken together, these measures would not only improve nutrition and food quality but could realistically save American families $2,500–$4,800 annually while strengthening resilient, local, and regional food systems.20
A Family First Vision to Lower Housing Costs
CRA has developed a comprehensive blueprint for lowering housing costs and restoring attainable homeownership for American families.21 The ongoing housing cost crisis in the United States is not a market fluctuation but a structural barrier to family formation, wealth-building, and family stability. Historically, homeownership was broadly accessible to the average family and was the central component of achieving the American dream. Today, the typical American household must earn $106,371 annually to afford a median-priced home of roughly $414,900; however, the national median household income is only $83,730, leaving a substantial affordability gap that places homeownership out of reach for many young families.22
Many explanations for this affordability gap focus on surface-level factors such as interest rates, inflation, or investor activity, but these address only a portion of the real housing distortion.23 The reality is that regulatory constraints on supply, misaligned tax incentives, barriers to down payment formation, and reduced market mobility have combined to raise costs and restrict access to ownership.24 CRA’s housing blueprint addresses these core issues and focuses on building “Trump Homes,” reducing the cost of purchase through targeted price reductions, enabling intergenerational wealth transfer with tax-advantaged First-Home Family Savings Accounts (FHFSAs), increasing market mobility with mortgage portability, and improving housing turnover through capital gains reform.25 In addition, foreign-buyer surcharges can serve as a funding mechanism for first-time entry grants without increasing federal deficits.26
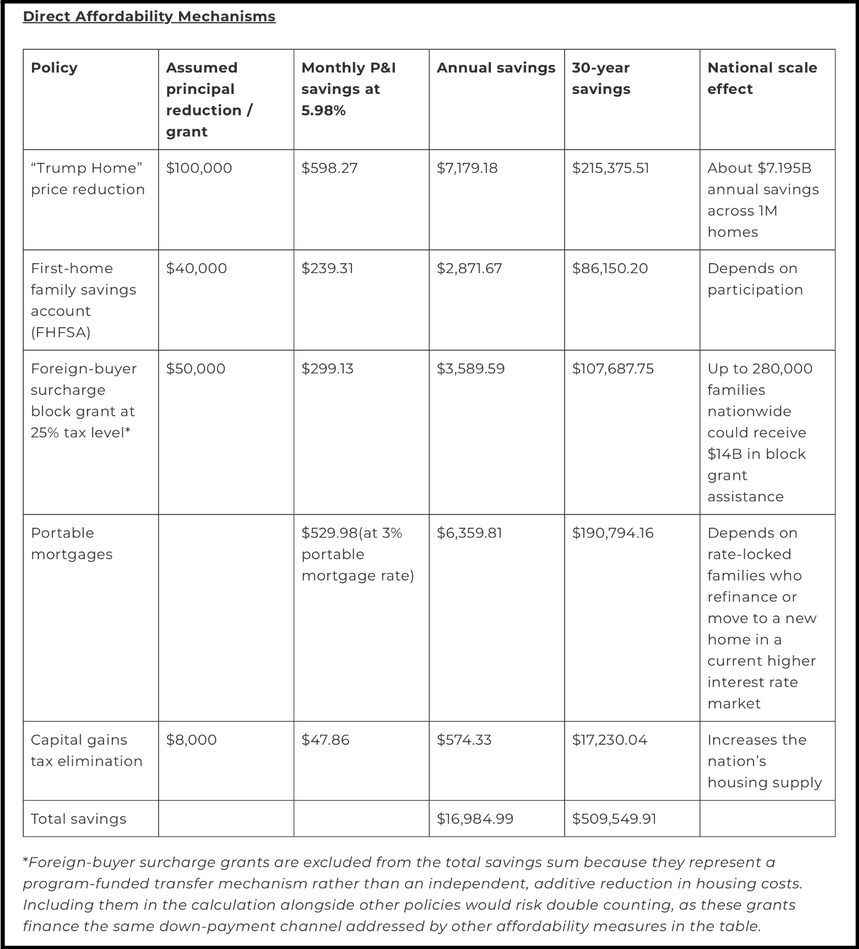
Combining these reforms produces substantial cost savings for first-time buyers and American families.27 A typical family entering the market could potentially save $16,984.99 per year in annual housing cost savings.28 The steep income threshold of $106,371 needed to afford a new home is no longer a significant barrier; CRA’s blueprint reduces that number to a maximum of $89,386.01.29 For a typical American family entering the housing market, this effect is transformative.30
Reducing Transportation Costs for American Families
CRA’s primer on transportation identifies how rising transportation costs are a direct result of policy choices, particularly energy and environmental regulations that have become increasingly woke, ideological, expansive, and detached from the needs of working families.31 Instead of lowering costs or improving mobility, these regulations have functioned as a form of top-down control over how Americans live and travel, driving up vehicle prices, restricting consumer choice, and increasing fuel and compliance costs across the system.32 Policies tied to aggressive emissions mandates and electric vehicle preferences imposed by the government have effectively acted as a hidden tax on gas-powered cars, making reliable and affordable transportation options more difficult for the families who depend on them most.33 These hidden taxes, along with expansive regulations and policies, have pushed the average price of a new car to almost $50,000. Americans now spend $13,000 per year on transportation costs.34
CRA’s transportation blueprint addresses these structural distortions directly by rolling back emissions mandates, eliminating regulatory barriers that inflate production costs, and restoring domestic energy independence.35 These reforms lower both up-front and recurring expenses by reducing vehicle prices, where regulatory compliance can add an estimated $5,000 to $10,000 per vehicle, and expanded energy production lowers fuel costs that often exceed $2,500 to $3,500 annually for a typical family.36 Additional reforms targeting insurance, financing, and compliance costs further reduce the total cost of ownership, including interest savings and reduced premium burdens.37
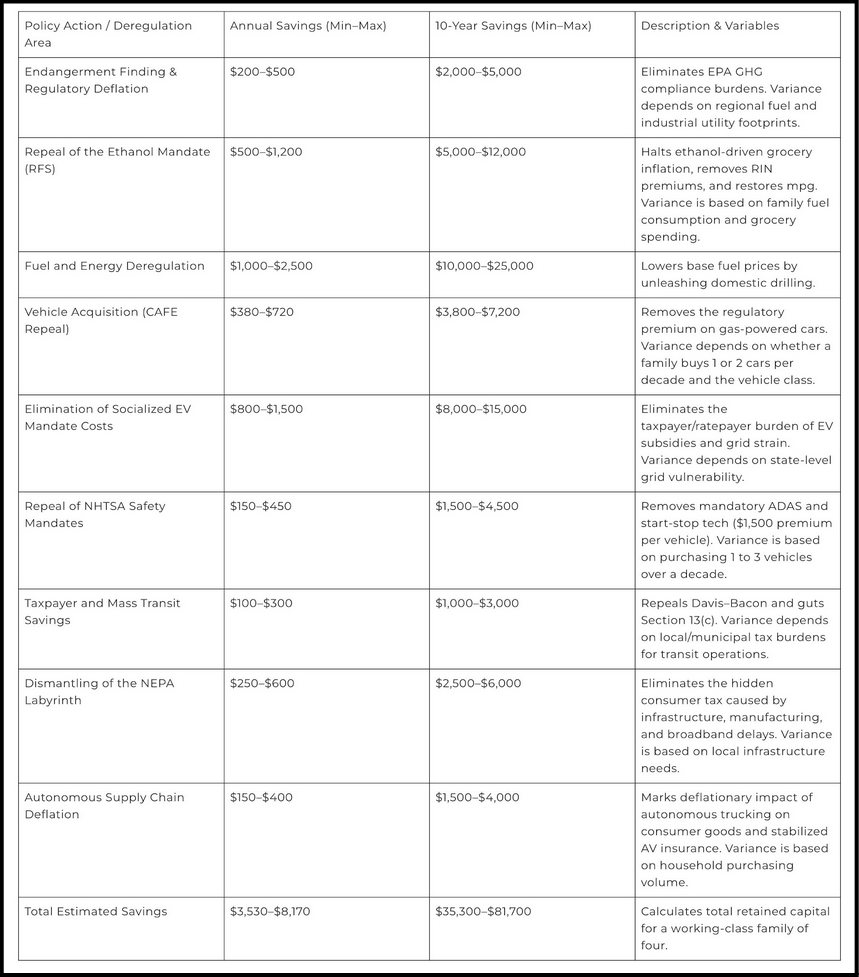
This chart suggests the proposed cuts and changes to regulations and other burdensome policies could produce substantial savings for American families.38 On the lower end, families could save at least $3,530 per year, and the higher end of the proposed savings could amount to at least $8,170, indicating the significant effect of reducing regulations and removing barriers for Americans to own, operate, and maintain transportation for their families and for the country to move and transport goods.39
Reducing Household Utility Costs
Similar to other issue areas, CRA’s primer on household utility costs identifies how rising electricity, heating, and energy bills are the direct result of progressive policy choices that benefit well-connected interests at the expense of families and working households.40 Instead of delivering reliable and affordable energy, these policies, heavily influenced by monopolistic directives, renewable energy mandates, and restrictions on domestic fuel production, have operated as a catalyst for structural price pressures for basic services.41 These efforts have driven up electricity generation costs and distorted energy markets, allowing utility companies to pass these regulatory costs on to consumers.42 Policies prioritizing intermittent energy sources and aggressive emissions targets have effectively acted as a hidden tax, making consistent and affordable energy more difficult to access.43 As a result, American families face rising utility bills that strain household budgets, particularly for those already burdened by housing and transportation costs.44
CRA’s utility cost blueprint addresses these structural distortions directly by restoring domestic energy production, rolling back burdensome regulations, and eliminating mandates that force higher-cost energy sources into the grid.45 These reforms lower both production and consumer costs by expanding supply and reducing compliance burdens, allowing utilities to deliver energy more efficiently and affordably.46 Increased domestic oil, gas, and coal production helps stabilize and reduce energy prices, and regulatory reform removes costly requirements that are ultimately passed on to ratepayers.47 Additional efforts to decentralize decision-making, remove telecommunications industry compliance costs, and reduce federal intervention in the market can further enhance competition and efficiency and lower the overall cost of energy for households. Together, these reforms aim to restore a reliable, affordable energy system that prioritizes the economic stability of American families over woke policy goals.
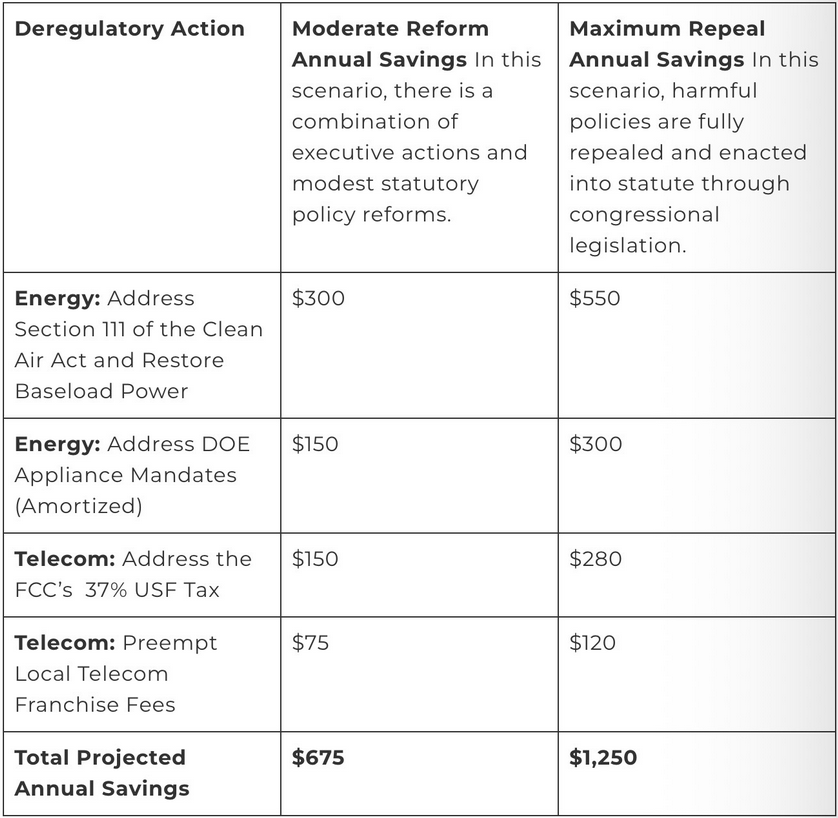
Under a targeted set of executive actions and congressional reforms, the average family of four paying $7,035 annually in utility costs could see savings of up to $675, or 9.6 percent, a meaningful and recurring relief on essential household expenses.48 These savings would come from reducing regulatory compliance costs, expanding domestic energy supply, and eliminating mandates that artificially inflate the cost of electricity and heating.49 With full statutory repeal of existing progressive energy policies, the impact becomes even more significant, with projected reductions reaching $1,250 annually, or 17.8 percent of the current cost burden.50 At that level, families would experience substantial annual savings driven by lower generation costs, more efficient energy markets, and the removal of hidden taxes embedded in the current regulatory framework.
Aggregate Savings Projections: A Tiered Analytical Model
To determine the holistic, cross-sector impact of the Family and Future Series policy agenda, this section synthesizes the disparate data points from all six primers into three scenarios: Minimal Savings, Moderate Savings, and Maximum Savings. These tiers reflect the varying degrees of political capital required to enact the proposals, ranging from unilateral executive action to cooperative congressional overhaul of existing statutory measures.
The aggregate savings figures presented here should be understood as directional estimates rather than precise, universally realized outcomes. Actual savings will vary based on regional cost differences, household composition, and fluctuations in underlying price levels across sectors. In addition, certain policy changes, particularly those affecting housing and capital-intensive markets, may realize their full financial benefits not immediately but over a longer time horizon as costs are amortized and market adjustments take effect. Nonetheless, these estimates offer a reasonable approximation of the order-of-magnitude relief that structural reform can deliver to the average American family.
Tier 1: Minimal Savings Projection
The Minimal Savings tier assumes a relatively pessimistic scenario in which Congress is entirely deadlocked, leaving the executive branch to rely solely on unilateral action.
In this strictly deregulatory scenario, an American household benefits from the dismantling of the bureaucratic labyrinth of the National Environmental Policy Act (NEPA), yielding $250 to $600 annually in transportation cost savings. Repealing National Highway Traffic Safety Administration safety mandates saves an additional $150 to $450 per year. Without new federal stipends, families must rely on the localized “Child Care Freedom” deregulations at the state and federal administrative level, which reduce center-based infant care costs by an average of $774 per year. Within the food sector, the immediate elimination of the executive-managed U.S. Sugar Program quotas provides $10 in annual consumer relief, while passive, nonsubsidized shifts toward local meat processing save a family $73 to $91 annually. In the health-care sector, opting for a church-based risk pool and direct primary care arrangement saves a family $6,800 annually compared to an unsubsidized Exchange plan, plus an estimated $200 in prescription medication savings. Finally, executive actions on appliance and telecommunications regulations would result in roughly $575 in annual savings.
Aggregating these primarily administrative rollbacks yields an estimated annual benefit of $8,832 to $9,500 per family. The fact that it is possible to free up over $8,800 annually through regulatory rollbacks and non-legislative health-care alternatives reveals the low-hanging fruit for family-first reform fighting policies forced on Americans by the weaponized bureaucracy’s war on the working class.
Tier 2: Moderate Savings Projection
The Moderate Savings tier assumes a cooperative legislative environment where fundamental energy deregulations are aggressively passed and targeted subsidies are authorized, while massive, multi-trillion-dollar market interventions (such as the $100,000 housing subventions or the maximum universal child-care stipends) are negotiated in Congress.
In this scenario, a household benefits from the median estimated savings generated by broad transportation deregulation. This includes the repeal of the EPA endangerment finding, Corporate Average Fuel Economy standards, and electric vehicle mandates, resulting in robust transportation savings of $3,530 to $5,000. In the family formation sector, Congress adopts the Targeted Median-Income stipend model, providing $2,604 annually to the 11.5 million households at or below median income, supplemented by the authorization of a $2,500 marriage bonus. In food policy, the widespread adoption of regenerative farming practices would translate into significant retail savings, including localized meat-processing reforms and sugar-quota repeals, resulting in approximately $400 in grocery deflation. Health-care restructuring and the adoption of second-tier policies save an average family $12,800 compared to unsubsidized plans, plus $200 in prescription savings. Congress successfully implements the FHFSA, allowing a tax-advantaged equity injection that saves a household $2,871.67 annually in mortgage costs, coupled with the $574.33 from capital gains elimination. Finally, utility and telecommunications policies undergo statutory changes, providing an additional $970 in estimated annual relief.
Aggregating these figures provides an estimated annual benefit of $26,450 to $27,920 per family. An annual injection of nearly $26,500 in liquidity fundamentally alters the financial security of a middle-quintile family, neutralizing current inflationary trends while insulating households against future energy and health-care shocks.
Tier 3: Maximum Savings Projection
The Maximum Savings tier represents the complete, unmitigated realization of CRA’s vision. It assumes the full repeal of the administrative state regulatory stranglehold, maximum authorization of pro-family tax credits, and profound structural reforms in the housing market.
In this optimal scenario, a typical family of four (married with two children and earning a median income) benefits from the maximum realized savings across all transportation metrics—including the repeal of the EPA endangerment finding, zero-emission mandates, NEPA, the Davis–Bacon Act, and full autonomous supply-chain integration—amounting to $8,170 annually. In the child-care sector, the family claims the fully expanded $17,500 Child Tax Credit, the $2,500 marriage bonus, and the monthly stipend, entirely wiping out out-of-pocket institutional costs and realizing a net retention of $17,708. Food savings max out at the full $4,800 through systemic regenerative efficiency and intentional statutory reforms. Health-care savings are maximized at $19,200 by avoiding inflated employer-sponsored premiums through direct primary care and catastrophic coverage, plus roughly $200 in medication savings. Crucially, a first-time homebuyer successfully stacks the $50,000 foreign-buyer surcharge block grant, the “Trump Home” $100,000 principal reduction, and FHFSA capital, yielding an unprecedented $16,985 in annual housing savings. The full statutory implementation of telecommunications and utility reforms yields another $1,250 in savings.
Under this comprehensive legislative and executive program, the estimated annual benefit scales to $68,313 per family. Returning over $68,000 in retained capital and reducing costs at this magnitude is sociologically transformative. It effectively serves as the targeted income replacement program required to remove the financial barriers that delay marriage, restrain family formation, and suppress the total fertility rate.
Perhaps most importantly, adopting CRA’s entire set of proposals provides an opportunity for households to once again live on a single income, giving families the option to have one parent stay home full-time. This option would transform homes across America, ensuring stronger parental engagement within the family and greater flexibility for parental involvement in the community.
Conclusion
The Family and Future Series presents a comprehensive, actionable road map for restoring the economic conditions necessary for strong family formation and long-term national renewal. Rather than offering generalized policy fixes, this series addresses the full cost structure facing American households, from health care, child care, and housing to food, transportation, and utilities. The series identifies how each has been shaped by progressive policy choices that have steadily made family life more difficult to attain and sustain. By targeting these structural distortions directly, CRA’s proposals not only reduce costs but also restore the feasibility of a stable household, expand parents’ ability to raise their own children, and reestablish the economic foundation on which strong families are built.
The strength of this work lies in its diagnosis and in its practical solutions. Across all the economic sectors covered, CRA advances reforms that produce measurable savings for American families, totaling tens of thousands of dollars annually when fully realized. Each of these policies produces immediate and long-term effects on household budgets, paving the way for healthier communities and more virtuous people.
The American dream is not abstract or out of reach; it is something that can be achieved and maintained through intentional, sustainable actions. When families are strong, society is strong. When society is strong, the nation is strong. These proposals do not cede the argument that the current crisis is about affordability—rather, they recognize that it is about family formation. For America to thrive, families must thrive. Therefore, the right kind of America First public policy is one that puts families first.
Endnotes
1. Paige Hauser, Primer: Family Formation and Child-Care Policies, THE CNTR. FOR RENEWING AM. (Feb. 12, 2026), https://americarenewing.com/issues/primer-family-formation-and-child-care-policies/.
2. Id.
3. Michael Green, Part 1: My Life Is a Lie, SUBSTACK, (Nov. 23, 2025), https://www.yesigiveafig.com/p/part-1-my-life-is-a-lie.
4. Wade Miller & Andrew White, Primer: An America First Vision for Health-Care, THE CNTR. FOR RENEWING AM. (Jan. 20, 2026), https://americarenewing.com/issues/primer-an-america-first-vision-for-health-care/.
5. Id.
6. Id.
7. Id.
8. Id.
9. Paige Hauser, Primer: Family Formation and Child-Care Policies, THE CNTR. FOR RENEWING AM. (Feb. 12, 2026), https://americarenewing.com/issues/primer-family-formation-and-child-care-policies/.
10. Id.
11. Id.
12. Paige Hauser, Primer: Reducing the Costs of Real Food for Families, THE CNTR. FOR RENEWING AM. (Mar. 16, 2026), https://americarenewing.com/issues/primer-reducing-the-costs-of-real-food-for-families/.
13. Id.
14. Id.
15. Id.
16. Id.
17. Id.
18. Id.
19. Id.
20. Id.
21. Benjamin Osborne, Primer: A Family First Vision to Lower Housing Costs, THE CNTR. FOR RENEWING AM. (Mar. 18, 2026), https://americarenewing.com/issues/primer-a-family-first-vision-to-lower-housing-costs/.
22. HSH, The Salary You Must Earn to Buy a Home in the 50 Largest Metros (Feb. 11, 2026), https://www.hsh.com/finance/mortgage/salary-home-buying-25-cities.html.
23. See Osborne, supra note 21.
24. Id.
25. Id.
26. Id.
27. Id.
28. Id.
29. Id.
30. Id.
31. CRA Staff, Primer: Reducing Transportation Costs for American Families, THE CNTR. FOR RENEWING AM. (Mar. 26, 2026), https://americarenewing.com/issues/primer-reducing-transportation-costs-for-american-families/.
32. Id.
33. Id.
34. Id.; U.S. BUREAU OF LABOR STATISTICS, U.S. DEP’T OF LABOR, Consumer Expenditures—2024 (2025), https://www.bls.gov/news.release/cesan.nr0.htm.
35. CRA Staff, supra note 31.
36. Id.
37. Id.
38. Id.
39. Id.
40. CRA Staff, Primer: Reducing Household Utility Costs, THE CNTR. FOR RENEWING AM. (Apr. 24, 2026), https://americarenewing.com/issues/primer-reducing-household-utility-costs/.
41. Id.
42. Id.
43. Id.
44. Id.
45. Id.
46. Id.
47. Id.
48. Id.
49. Id.
50. Id.
Referenced Documents
Related Posts


The Article I Path to Ending Birthright-Citizenship Abuse
Congress should go on offense and respond immediately by amending 8 U.S.C. § 1401(a) to codify what the Fourteenth Amendment already requires: citizenship at birth belongs only to persons born in the United States while subject to the nation’s complete political jurisdiction.