
Primer: Reducing the Costs of Real Food for Families
The animating concern of this series of primers is the future of healthy family formation. It is a central purpose of government to cultivate a country in which citizens can marry, have children, and remain married. The financial obstacles to that way of life are addressed throughout the series. Here we address rising food costs.
Family and Future Series
The animating concern of this series of primers is the future of healthy family formation. It is a central purpose of government to cultivate a country in which citizens can marry, have children, and remain married. The financial obstacles to that way of life are addressed throughout the series. Here we address rising food costs.
Introduction
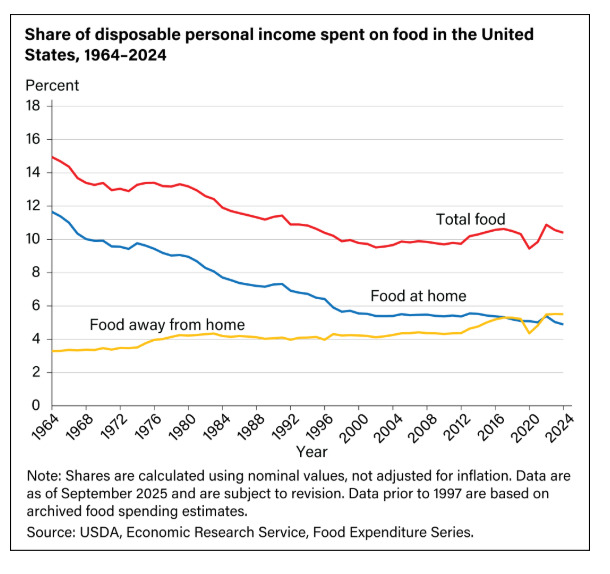
In the United States, food has been a significant component of household expenditures. In fact, one of the U.S. government’s official poverty measures is determined based on a calculation of three times the cost of food in 1963 adjusted for inflation.1 At the time the measure was established, families of three or more spent about one-third of their after-tax income on food, so the poverty line was set at three times the cost of the government’s “economy” food plan, assuming that when food spending was reduced to that bare-minimum level, nonfood spending would also be reduced proportionally to a minimally adequate level.2 In 2023, household expenditures on food accounted for 12.9 percent of personal income, which ranks third behind housing (32.9 percent) and transportation (17.0 percent).3 In 2024, the share of disposable personal income spent on food has trended downward to 10.4 percent.4
Historically, food prices have tended to rise modestly and roughly in line with overall inflation. That pattern broke down beginning in 2021. From 2020 to 2024, food prices rose 23.6 percent, outpacing most historical annual averages and the 21.2 percent increase in the Consumer Price Index. After the disruptions of the COVID-19 pandemic in 2020–2021, food inflation accelerated sharply in 2022 to its highest level since 1979 as supply shocks, energy costs, and global instability compounded broader inflationary pressures during the Biden administration. Although price growth moderated in 2023 and 2024, American families are still left with a permanently higher cost baseline for groceries.5
Inflation in the cost of healthy food has been particularly acute: Major categories tracked by the Bureau of Labor Statistics (BLS) show strong price surges in, for example, meats, poultry, fish, and eggs, up 36.4 percent since 2020, with eggs more than doubling in price for much of that period.6
These rising costs disproportionately impact lower-income families. Households in the lowest quintile spend around 32.6 percent of after-tax income on food, compared with 8.1 percent for the highest quintile.7 The middle quintile had before-tax incomes ranging from about $55,000 to $90,000 in 2023.8 Households in this quintile spent, on average, about $9,000 on food in 2023, which was about 13.5 percent of after-tax income (see nearby chart).
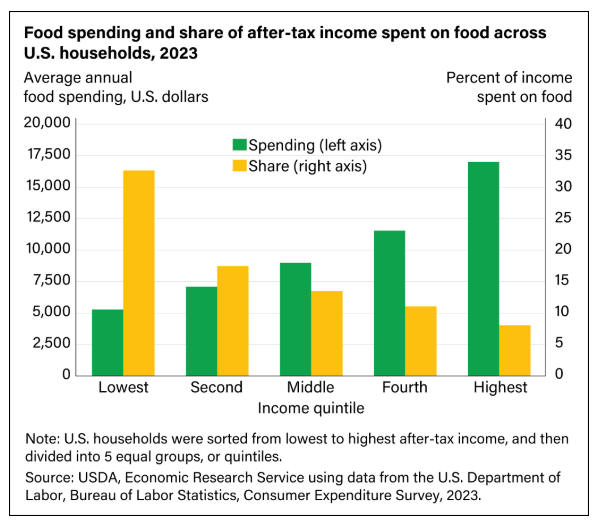
For middle-income households (those earning roughly $55,000 to $90,000 in 2023), the recent surge in food prices represents a measurable but not catastrophic erosion of living standards, compounding broader cost pressures rather than driving them on their own. With the middle quintile spending about $9,000 annually on food, the 23.6 percent increase in food prices since 2020 means that a comparable household was spending roughly $7,300 on groceries just four years earlier. That difference (about $1,700 to $2,000 per year) amounts to roughly 2.5–3 percent of a representative household’s disposable income, assuming an annual income of $70,000. While food now consumes a far smaller share of income than in the 1960s, the post-2020 inflation spike has permanently raised the baseline cost of essential goods, reducing discretionary income and financial resilience. For middle earners, the result is a sustained squeeze: not a collapse into poverty but a steady narrowing of economic margin driven by elevated costs layered on top of already dominant expenses such as housing and transportation. This is the type of trend policymakers should be concerned about when determining how best to help families form and thrive.
The steady erosion of middle-class purchasing power makes family formation more financially daunting and perhaps harder to achieve. Even a seemingly modest $1,700–$2,000 annual increase in grocery costs adds up when combined with elevated housing, child care, health care, and transportation expenses. Loosening the tension in household budgets precisely at the stage of life when Americans are deciding whether they can afford marriage, children, or a home in which to raise a family is the central concern of this primer series. If policymakers are serious about reversing declining birth rates, then restoring middle-class security and reducing the structural drivers of tightening household budgets must be a part of the solution. Here we offer options for easing the pressure on household grocery bills. These policies would help rebuild the economic margin that makes family formation and upward mobility possible.
Addressing Structural Cost Drivers
One explanation for the rapid rise in food costs between 2020 and 2024 includes “global trade issues, weather events and climate change, animal and plant disease, the COVID-19 pandemic, and the Russia-Ukraine conflict.”9 Unfortunately, this raises more questions than it answers. For example, COVID-19 has long ceased to be a crisis, weather events have been happening since Genesis 3, and so have plant and animal diseases. Another report expects food prices to increase slightly in 2026, but for different reasons. The predicted increases are marked by a shift in consumers eating out less and spending more at the grocery store; Gen Z and Gen Alpha entering the market and favoring more snacks, fresh produce, and energy drinks; and finally, new, more expensive foods becoming available, with consumers tending to try them at least once. Together, this means that even as inflationary pressures ease, prices may not. Average weekly grocery spending is now $170, up from 2020, when households spent $120 on average per week.10
The reality is that food affordability is a function not merely of inflation but of structure. Market concentration, regulatory distortions, supply chain complexity, and policy-shaped demand patterns all contribute to elevated and volatile costs. The corresponding reforms—decentralization, restoration of competition, regulatory reform, and an emphasis on regenerative production—operate at the same structural pressure points.
1. Concentration, Decentralization, and Regenerative Agriculture
Today, many farms are not owned by the farmers who cultivate them. Instead, corporate conglomerates and out-of-state entities are buying up farmland, reducing the farmers to tenant status with limited ability to make production decisions. Indeed, 20–25 percent of the land in Iowa is owned by firms outside the state: farm management companies, LLCs, and the like.11
Meat processing is also a highly concentrated sector, where a handful of corporations process a dominant share of cattle, reducing competition and contributing to price spikes. In late 2025, the U.S. Department of Justice launched a probe into price-fixing and anticompetitive behavior among major meatpackers, which process about 85 percent of cattle.12
Such concentration is not necessarily bad for consumer prices, but it comes at a high cost to the overall health of the food system and the Americans who are dependent on it. Concentration results in fewer buyers for what farmers produce and greater susceptibility to bottlenecks and shocks (a weakness starkly revealed by the COVID-19 pandemic).
In a previous paper, we argued that redeveloping local agriculture would allow for distributed regional food networks.13 This change would shorten transportation distances, reduce spoilage, and strengthen community food resilience. Smaller processing hubs (e.g., small and mobile meatpacking centers and farmer co-ops) can help stabilize supply, especially for perishable goods like meat and produce, and mitigate costs associated with long-haul logistics.
Federal and state regulatory frameworks currently constrain small-scale meat processors, leading to bottlenecks that elevate prices in concentrated markets. Regulatory reforms that safely expand capacity for noncommercial and regional meat processing can diversify supply sources and reduce dependence on the few large processors. Streamlined inspection protocols and support for mobile slaughter units would help smaller producers compete in local markets.
Ultimately, the aim is to reduce barriers to entry for small and local producers. Reports from the U.S. Department of Agriculture (USDA) and related analyses show that local beef supply chains currently face higher retail prices (about $8.00 per pound for locally marketed beef versus $4.65 per pound for commodity beef) largely because of limited local processing capacity and high per-unit costs, including trucking and slaughtering expenses.14 Reducing long-haul distances and building more local and regional processing capacity can cut trucking and handling costs, enabling producers to retain more value and potentially pass savings to consumers (for example, lowering transport costs that otherwise add significantly to per-pound costs). By using local meat processors, producers can save roughly $70–$80 per 600-pound animal in transport, processing, and packaging costs. These efficiencies can translate into savings of about $0.20–$0.25 per pound for consumers, meaning a household purchasing 365 pounds of beef annually (1 pound per day) could save $73–$91 while also getting fresher, higher-quality meat.15
Families with higher grocery bills could also consider buying regeneratively raised meat in bulk from local sources. Half a cow typically yields 200–250 pounds of beef and could feed a family of four for six to eight months if they eat beef three to four times a week.16 At roughly 20–30 percent less than the price of individual cuts at the grocery store, meat purchased this way leads to substantial savings.17 Increasing demand for local regenerative meat can help these operations grow and scale, and, over time, reduce costs across the board.
In a previous paper, we outlined how using regenerative practices could increase returns on the investment, decrease fertilizer and pesticide use, and enhance soil health and crop yields.18 Research on regenerative farm systems in Texas similarly shows that regenerative farms dramatically reduce key input costs compared with conventional farms:
- Synthetic nitrogen fertilizer costs drop from about $80–$150 per acre to $0–$30 per acre (saving roughly $50–$120/acre).
- Pesticide costs fall from about $50–$200 per acre to $0–$25 per acre (saving about $25–$175/acre).
- Herbicide costs fall from about $30–$100 per acre to $0–$15 per acre (saving about $15–$85/acre).
- Fuel and tillage costs drop from about $40–$80 per acre to $10–$25 per acre (saving about $15–$55/acre).
- Total Annual Savings: Conventional systems cost $200—$530 per acre, while regenerative systems cost $10–$95 per acre, resulting in total annual savings of $105–$435 per acre.
Reduced input costs through natural systems eliminate the expenses associated with synthetic fertilizers, pesticides, and fuel for tillage operations while maintaining or improving agricultural productivity. Regenerative farms typically reduce input costs by $150–$400 per acre annually.19 As these practices are scaled and become more widespread, those savings per acre can be passed on to the consumer. In addition to the higher quality and nutritional value of the food and improved environmental impacts, these changes also translate into cost savings, including in reduced health-care costs. The same Texas study cited above estimates that the total real costs of conventional food production are $1,000–$1,600 per acre, whereas the total costs of regenerative food systems are –$100 to +$200 per acre.20 Regenerative agriculture in Texas can reduce farm input costs by approximately $105–$435 per acre compared with conventional practices,21 which, when combined with local processing and shorter supply chains, could translate into retail price reductions of roughly $0.30 per pound for consumers. For a typical household purchasing 1,000 pounds of food annually, this could mean $300 in potential annual savings while also providing fresher, higher-quality products and supporting resilient local food systems.22
2. Regulatory Distortions and Reforms
Federal sugar policy under the U.S. Sugar Program maintains subsidies and import restrictions, resulting in domestic sugar prices often above world levels that cost consumers an estimated $2.5 billion–$3.5 billion annually.23 If those costs were translated into savings by elimination of the program, the typical consumer would pay $3–$10 less per year on sugar and sugar-dependent products if prices aligned with world market levels.24
Commodity programs that favor inputs for ultra-processed foods (such as corn and soy) artificially lower their prices and distort incentives for crop diversity. The current U.S. commodity programs (corn, soy, wheat, cotton, rice, etc.) often guarantee a price floor or provide direct payments, policies that encourage farmers to stick with program crops, even if market demand or profitability would otherwise favor alternative crops. Without these subsidies, farmers would have more flexibility to respond to actual consumer demand rather than guaranteed prices.
In the current system, subsidies favor commodity crops and large-scale monocultures, which means many fruits and vegetables must be imported or stored long-term to meet year-round demand. Imported or out-of-season produce often comes with higher transport, storage, and spoilage costs, which are passed on to consumers. Changes to the commodity program could be the driving force that shifts demand to seasonal products, which are cheaper than imported out-of-season produce. Consumers eating in season would pay lower prices because produce grown locally does not require long-distance shipping, storage costs are minimized (less cold storage means fewer preservatives), and supply meets natural harvest peaks, reducing scarcity premiums.
Eliminating U.S. commodity programs could incentivize farmers to diversify crops in response to market demand, potentially increasing the supply of underproduced foods and introducing competition that modestly lowers retail prices for consumers. While savings would likely be gradual and limited, the shift could help make fresh and specialty foods more affordable over time. Additionally, by aligning consumer purchases with seasonal harvests, households could pay lower retail prices for fruits and vegetables while also enjoying fresher, higher-quality products and supporting resilient local food systems.
3. Realigning Nutrition Standards and Markets
Growing reliance on food delivery services and restaurant meals through platforms such as Uber Eats and DoorDash reflects consumer demand for convenience but increases per-meal costs compared to home-cooked options.25 Delivery fees, service charges, and restaurant markups compound the already-higher price of prepared food, contributing to the long-term rise in household food expenditures. As Department of Health and Human Services (HHS) Secretary Robert F. Kennedy Jr. has emphasized, many Americans have lost basic cooking skills; restoring the culture of eating at home could help reduce food costs, improve nutrition, and build stronger families. He has also proposed that HHS find ways to support such education.26 Using BLS data, the per-meal cost of dining out for a typical family of four is roughly four times that of cooking at home. Replacing just one restaurant meal per week with a home-cooked meal could save that family nearly $2,000 annually, and replacing two meals per week could save close to $4,000.27
Beyond consumer behavior and the structural inefficiencies outlined above, the food system supply chain adds substantial costs before food ever reaches the household. Processing alone accounts for roughly 25 percent of retail food costs, with packaging, wholesaling, transportation, and retailing adding significantly more.28 Highly concentrated agricultural production often requires long-distance transportation and extended supply chains, which increase both costs and vulnerabilities. At the same time, an estimated 30–40 percent of the U.S. food supply goes uneaten across retail and consumer levels, translating to nearly $2,900 per household of four annually in wasted food.29
Federal nutrition programs also shape food markets in ways that can increase costs and reduce nutritional quality. The Supplemental Nutrition Assistance Program (SNAP) currently allows benefits to be used on a wide range of highly processed foods, including sugar-sweetened beverages and other ultraprocessed products. The Trump administration approved numerous state waivers restricting such purchases using SNAP benefits, an initial step toward improving program outcomes and human health. A more ambitious reform proposed during the administration’s first term, the Harvest Box concept, would supplement or partially replace SNAP benefits with regular deliveries of nutritious foods such as fruits, vegetables, and proteins sourced from regional producers. At the time, the program was estimated to save roughly $129 billion over a decade.30 A Harvest Box model would have added benefits, such as reducing household budgeting stress, and could channel demand directly into local producers, fostering stable markets for smaller local and regional farms.
Federal nutrition policy is also being reshaped through a joint initiative of HHS and USDA to update the U.S. Dietary Guidelines.31 The revised guidelines emphasize the benefits of eating whole, nutrient-dense foods such as meat, dairy, fruits, and vegetables, and discourage the consumption of highly processed foods and added sugars. Because federal nutrition guidance governs purchasing standards for programs such as school lunches, military dining facilities, and other federally funded entities, the revised guidelines could redirect billions of dollars in annual federal food purchases toward fresher, healthier foods.
Over time, the increased demand for whole foods could lead to higher production and lower costs. Federal food purchases currently total over $33 billion annually, with roughly 45 percent going to small or regional suppliers.32 By shifting more toward local and minimally processed whole foods, the government can cut distribution and handling costs and create competitive pressure that lowers wholesale prices, perhaps up to 16 percent.33
Finally, policies that address food waste represent a major opportunity to reduce costs across the food system. With roughly one-third of food produced in the United States lost or wasted, improving recovery and redistribution systems could lower overall supply costs while increasing food availability. Policies that incentivize food donation, standardize date labeling, and improve retail inventory management can make food supply more efficient and reduce waste.34
Combining these reforms across America’s food system could save a typical family of four thousands of dollars each year. Expanding local and regional meat processing, shortening supply chains, and adopting regenerative agriculture practices could reduce retail food costs by roughly $300–$400 annually, and eliminating the U.S. Sugar Program would save households $3–$10. Cooking at home just once or twice more per week could cut dining-out expenses by $2,000–$4,000 per year, and shifting federal procurement toward local, minimally processed foods could generate additional wholesale cost reductions for families, conservatively valued at $100–$200. Households that switch to buying meat in bulk may save 20-30 percent on their conventional meat purchases at the grocery store. Finally, tackling food waste through improved recovery, redistribution, and inventory management could lower household food costs by another $100–$150 per year. Taken together, these measures would not only improve nutrition and food quality but could realistically save American families $2,500–$4,800 annually while strengthening resilient, local, and regional food systems.
Conclusion
Reforming the U.S. food system to reduce costs is not a short-term project. Families whose typical monthly grocery haul relies heavily on ultraprocessed foods may find that their food costs initially rise as their buying shifts toward healthier real-food choices. However, such an investment in health yields long-term savings, especially in reduced health-care costs associated with avoiding diet-fueled chronic disease. As more and more families demand improvements in the quality of the food they purchase, supply chains can respond, and local small farms can scale, reducing costs in the long term. Further, prioritizing regenerative agriculture and local markets, welfare reforms that deliver nutritious food directly to families, and regulatory changes that reduce waste and decentralize procurement and processing can help the nation create a more competitive, resilient, and affordable food system. Over time, these efforts will translate into lower prices for consumers, healthier diets for families, and more sustainable agricultural economies nationwide.
Endnotes
1. John Creamer and Kalee Burns, “What’s the Difference Between the Supplemental and Official Poverty Measures?” Random Samplings (U.S. Census Bureau blog), September 6, 2023, https://www.census.gov/newsroom/blogs/random-samplings/2023/09/difference-supplemental-and-official-poverty-measures.html
2. U.S. Department of Health and Human Services, Office of the Assistant Secretary for Planning and Evaluation, “History of Poverty Thresholds,” accessed March 10, 2026, https://aspe.hhs.gov/topics/poverty-economic-mobility/poverty-guidelines/further-resources-poverty-measurement-poverty-lines-their-history/history-poverty-thresholds
3. U.S. Department of Agriculture, Economic Research Service, “Food Accounted for 12.9 Percent of American Households’ Expenditures in 2018,” Chart Gallery, accessed March 10, 2026,https://www.ers.usda.gov/data-products/chart-gallery/chart-detail?chartId=58276
4. U.S. Department of Agriculture, Economic Research Service, “Food Prices and Spending,” Ag and Food Statistics: Charting the Essentials, accessed March 10, 2026, https://www.ers.usda.gov/data-products/ag-and-food-statistics-charting-the-essentials/food-prices-and-spending
5. Ibid.
6. Pew Research Center, “5 Facts About Food Costs in America,” Short Reads, May 15, 2025,
7. U.S. Department of Agriculture, Economic Research Service, “Food Prices and Spending,” Ag and Food Statistics: Charting the Essentials, updated March 10, 2026, accessed March 10, 2026, https://www.ers.usda.gov/data-products/ag-and-food-statistics-charting-the-essentials/food-prices-and-spending
8. U.S. Bureau of Labor Statistics, Consumer Expenditures in 2023, Shane Meyers, Geoffrey D. Paulin, and Kristen Thiel, BLS Report 1112 (Washington, DC: U.S. Bureau of Labor Statistics, December 2024) (see footnote 19). https://www.bls.gov/opub/reports/consumer-expenditures/2023/
9. U.S. Government Accountability Office, Food Prices: Information on Trends, Factors, and Federal Roles, GAO‑23‑105846 (Washington, DC: U.S. Government Accountability Office, March 28, 2023),https://www.gao.gov/products/gao-23-105846
10. Elizabeth Crawford, “Food Inflation Will Cool in 2026 but Grocery Bills May Continue to Rise,” FoodNavigator‑USA, February 24, 2026, https://www.foodnavigator‑usa.com/Article/2026/02/24/2026‑food‑price‑outlook‑grocery‑inflation‑slows‑dining‑costs‑up/
11. Erin Jordan, “Who Owns Iowa Farmland? Too Often, It’s Not Farmers,” AgDaily, October 20, 2023, https://www.agdaily.com/insights/who-owns-iowa-farmland-too-often-its-not-farmers/; Jingyi Tong and Wendong Zhang, Iowa Farmland Ownership and Tenure Survey 1982–2022: A Forty‑Year Perspective, Working Paper 23‑WP 651 (Ames, IA: Center for Agricultural and Rural Development, Iowa State University, August 2023), https://farmland.card.iastate.edu/files/inline‑files/farmland‑ownership‑tenure‑2022_0.pdf; and Paige Hauser, “Primer: Making America Healthy Again Means Reforming the Food System,” The Center for Renewing America, September 10, 2025, https://americarenewing.com/issues/primer-making-america-healthy-again-means-reforming-the-food-system/
12. Jody Godoy and Tom Polansek, “Trump Says He Asked DOJ to Investigate Meat‑Packing Companies Driving Up Beef Prices,” Reuters, November 7, 2025,
13. Paige Hauser, “Primer: Making America Healthy Again Means Reforming the Food System,” The Center for Renewing America, September 10, 2025, https://americarenewing.com/issues/primer-making-america-healthy-again-means-reforming-the-food-system/
14. Agralytica (prepared for the U.S. Department of Agriculture, Risk Management Agency and Farm Production and Conservation Business Center), Feasibility of Insuring Local Food Production: Final Research Report, 12FPC320F0125 (Alexandria, VA: Agralytica, January 2021), https://www.rma.usda.gov/sites/default/files/topics/Feasibility-of-Insuring-Local-Food-Production.pdf
15. Because direct studies quantifying per-animal “$70–$80 savings” or exact per-pound consumer savings as a result of local capacity are not standardized in the literature, this summary instead bases the cost differences on published USDA economic modeling while linking those differences to the transport and processing cost drivers, (like those cited in Ellen Dickenson, Spirit Joseph, and Jonathan Ward, Confronting Challenges in the Local Meat Industry: Focus on the Pioneer Valley of Western Massachusetts, report prepared for Community Involved in Sustaining Agriculture (University of Massachusetts, Amherst, Isenberg School of Management, Summer 2013), https://www.buylocalfood.org/local-meat-processing-study/) that policy interventions like investments in local processing are designed to address.
16. Half a Cow Club, “How Many People Does Half a Cow Feed?,” accessed March 11, 2026, https://halfacowclub.com/calculators/servings
17. Bridget Shirvell, “Home Cooks Are Buying Whole Cows and Saving Big—Here’s How to Do It,” Martha Stewart, updated on October 22, 2025, https://www.marthastewart.com/how-to-buy-whole-cow-11828111
18. Paige Hauser, “Primer: Making America Healthy Again Means Reforming the Food System,” The Center for Renewing America, September 10, 2025, https://americarenewing.com/issues/primer-making-america-healthy-again-means-reforming-the-food-system/
19. Troy Patterson, “Regenerative Agriculture: The Complete Environmental Solution,” Texas Grass Fed Farms (blog), December 14, 2025, https://texasgrassfedfarms.com/blogs/regenerative‑agriculture/regenerative‑agriculture‑the‑complete‑environmental‑solution
20. Ibid.
21. To give a similar example from elsewhere in the United States: Estimated per-acre input savings for regenerative corn in the U.S. Midwest are based on a study (Claire E. LaCanne and Jonathan G. Lundgren, “Regenerative Agriculture: Merging Farming and Natural Resource Conservation Profitably,” PeerJ 6 (2018): e4428, https://doi.org/10.7717/peerj.4428) that reported on the elimination of synthetic fertilizer, pesticide, and herbicide use and reduced fuel/tillage through no-till practices. Using typical Midwest input costs (fertilizer $0.60–$1.00/lb N; pesticides $40–$100/acre; herbicides $20–$60/acre; fuel/tillage $10–$50/acre), total input savings are roughly $100–$400 per acre.
22. The estimated $0.30-per-pound consumer savings is based on input cost reductions from regenerative agriculture in Texas, which range from $105–$435 per acre for fertilizer, pesticides, herbicides, and fuel/tillage. Assuming an average edible yield of 1,000 pounds of food per acre, the midpoint savings of $270 per acre translates to $0.27 per pound ($270 ÷ 1,000 lb.). Additional efficiencies from shorter transport distances, shared local processing, and reduced spoilage round the savings to approximately $0.30 per pound.
23. Andy Hanacek, “GAO: USDA’s Sugar Program Costs Consumers $2.5–$3.5 Billion a Year,” FoodProcessing.com, November 1, 2023, https://www.foodprocessing.com/business-of-food-beverage/business-strategies/news/33014114/gao-usdas-sugar-program-costs-consumers-25-35-billion-a-year
24. Chuck Dinerstein, “The Sticky and Sickly(?) Price of America’s Sugar Subsidy,” American Council on Science and Health, November 11, 2024, https://www.acsh.org/news/2024/11/11/sticky-and-sickly-price-americas-sugar-subsidy-49105
25. U.S. News & World Report, “Is Fast Food Cheaper Than Cooking at Home?,” Money, May 20, 2022, https://money.usnews.com/money/personal-finance/articles/is-fast-food-cheaper-than-cooking-at-home
26. Elizabeth Weibel, “RFK Jr. Announces Plan to Teach Americans to Cook: ‘Americans Have Forgotten How to Cook,’” Breitbart, March 4, 2026, https://www.breitbart.com/health/2026/03/04/rfk-jr-announces-plan-to-teach-americans-to-cook-americans-have-forgotten-how-to-cook/
27. U.S. Bureau of Labor Statistics, The Economics Daily: “The New Year and Household Spending,” January 5, 2026, accessed March 10, 2026, https://www.bls.gov/opub/ted/2026/the-new-year-and-household-spending.htm
28. Megan Sweitzer, Matthew MacLachlan, Wilson Sinclair, Alexander Stevens, Hayden Stewart, James Chandler Zachary, and Eliana Zeballos, “ERS Data Products Show Food‑at‑Home Price Inflation from Producers to Consumers,” Amber Waves: The Economics of Food, Farming, Natural Resources, and Rural America, U.S. Department of Agriculture, Economic Research Service, July 10, 2023, https://www.ers.usda.gov/amber-waves/2023/july/ers-data-products-show-food-at-home-price-inflation-from-producers-to-consumers
29. U.S. Department of Agriculture, “Food Loss and Waste FAQs,” Food Loss and Waste, accessed March 10, 2026, https://www.usda.gov/about‑food/food‑safety/food‑loss‑and‑waste/food‑waste‑faqs
30. Chuck Abbott, “White House Plan: Cut Food Stamp Eligibility, Give People a Box of Food,” Agriculture.com, February 13, 2018, https://www.agriculture.com/news/business/white‑house‑plan‑cut‑food‑stamp‑eligibility‑give‑people‑a‑box‑of‑food
31. U.S. Department of Health and Human Services, “Fact Sheet: Trump Administration Resets U.S. Nutrition Policy, Puts Real Food Back at the Center of Health,” January 7, 2026, accessed March 10, 2026, https://www.hhs.gov/press‑room/fact‑sheet‑historic‑reset‑federal‑nutrition‑policy.html
32. U.S. Government Accountability Office, Federal Food Purchases: Buying from Small Businesses and Local Sources, GAO‑24‑106602 (Washington, DC: U.S. Government Accountability Office, March 20, 2024), https://www.gao.gov/products/gao-24-106602
33. Data from USDA’s Economic Research Service show that smaller school food purchasers pay up to 16 percent more for fruits and vegetables than larger-volume purchasers. Expanding federal procurement of local and regional whole foods could achieve similar economies of scale, reducing distribution and handling costs while supporting local suppliers. See: Michael Ollinger and Joanne Guthrie, “Volume of Purchases and Regional Location Have Strong Effects on Food Costs for School Meals,” Amber Waves: The Economics of Food, Farming, Natural Resources, and Rural America, U.S. Department of Agriculture, Economic Research Service, April 1, 2019, https://www.ers.usda.gov/amber-waves/2019/april/volume-of-purchases-and-regional-location-have-strong-effects-on-food-costs-for-school-meals
34. U.S. Department of Agriculture, “Food Loss and Waste FAQs,” About Food: Food Safety—Food Loss and Waste, accessed March 10, 2026, https://www.usda.gov/about‑food/food‑safety/food‑loss‑and‑waste/food‑waste‑faqs
Referenced Documents
Related Posts

Primer: Reducing Transportation Costs for American Families
The path to reliable and affordable transportation does not run through more federal spending, heavier top-down regulation, climate extremism, or capitulation to union bosses. It requires dismantling the administrative hurdles that inflate costs, restrict choice, and punish the working class.

Primer: Reducing the Costs of Real Food for Families
The animating concern of this series of primers is the future of healthy family formation. It is a central purpose of government to cultivate a country in which citizens can marry, have children, and remain married. The financial obstacles to that way of life are addressed throughout the series. Here we address rising food costs.